Introduction:By connecting to the massive database of the SOED data center, SatCO2 can access remote sensing, model simulation, and in-situ datasets, as well as display accessed data in a 3D sphere Users can ... 【Unfold】
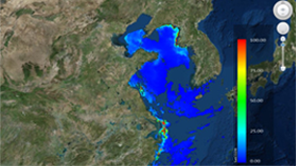
Introduction:SatCO2 can display the loaded data in a 3D geosphere, and also supports user-defined display modes, including: 1) custom color bar; 2) overlay display and image transparency settings; 3) 3D sphere vi... 【Unfold】
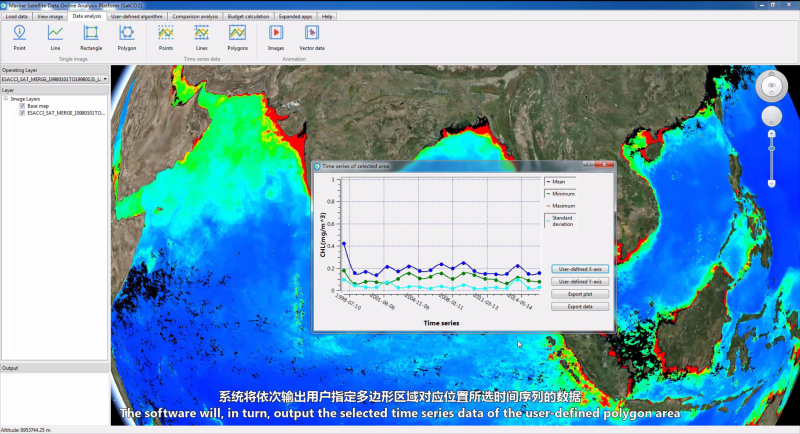
Introduction:SatCO2 can perform statistical analysis of selected points, lines, and areas from the currently active layer Users can also conduct time-series analysis for the selected points, lines, and areas by ... 【Unfold】
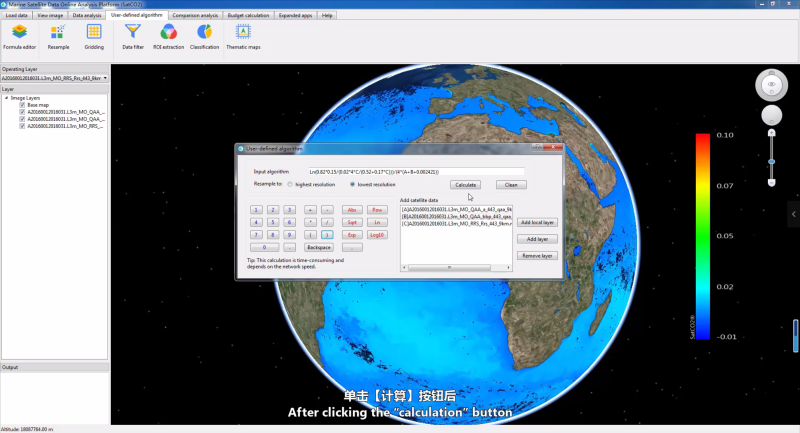
Introduction:SatCO2 can carry out a variety of user-defined calculations on remote sensing data, including: 1) convenient algorithm coding with a click of the mouse, and visualization of newly generated remote sen... 【Unfold】
Introduction:SatCO2 can conduct multiple data comparison analyses, including: 1) use of in-situ data to verify remote sensing products by their matchups; and, 2) comparison between remote sensing data in selected ... 【Unfold】
Introduction:SatCO2 can be used to calculate air-sea CO2 flux based on remote sensing or in-situ data, including: 1) calculation of air-sea CO2 flux based on remote sensing data (default or user-defined algorithm... 【Unfold】
Address:36 Baochubei Road, Hangzhou, Zhejiang Province, China
Tel:+86-571-8196 3198
Fax:+86-571-8883 9374
Zip:310012
Copyright©2019-2026 State Key Laboratory of Satellite Ocean Environment Dynamics. All Right Reserved
Technical Support:Cuncao Xin Technology Background Login
浙ICP备10040255号-10