Researcher BAI Yan from our laboratory and her collaborators published a paper titled "Spatial and temporal variations in sea surface pCO2 and air-sea flux of CO2 in the Bering Sea revealed by satellite-based data during 2003–2019" in Frontiers in Marine Science, a well-known journal in the field of oceanography. The first author of the paper is Dr. ZHANG Siqi from our laboratory, and the corresponding author of the paper is researcher BAI Yan. The collaborators include researcher HE Xianqiang, associate researcher LI Teng, senior engineer GONG Fang, Dr. YU Shujie, academician PAN Delu and the student JIANG Zhiting who has been jointly trained by Shanghai Jiao Tong University.
The Bering Sea is an important channel for the North Pacific seawater to enter the Arctic. Understanding the long-term series changes in sea-to-air carbon dioxide (CO2) flux in the Bering Sea has important reference significance for global carbon cycle research. Based on the Bering Sea seawater partial pressure of carbon dioxide (pCO2) data and multi-source satellite data, this study used the Gaussian Process Regression (GPR) model to invert the Bering Sea seawater pCO2 from 2003 to 2019, and estimated the corresponding sea-to-air CO2 flux. , and on this basis, the spatial and temporal distribution and main control mechanisms of seawater pCO2 and sea-to-air CO2 flux were analyzed.
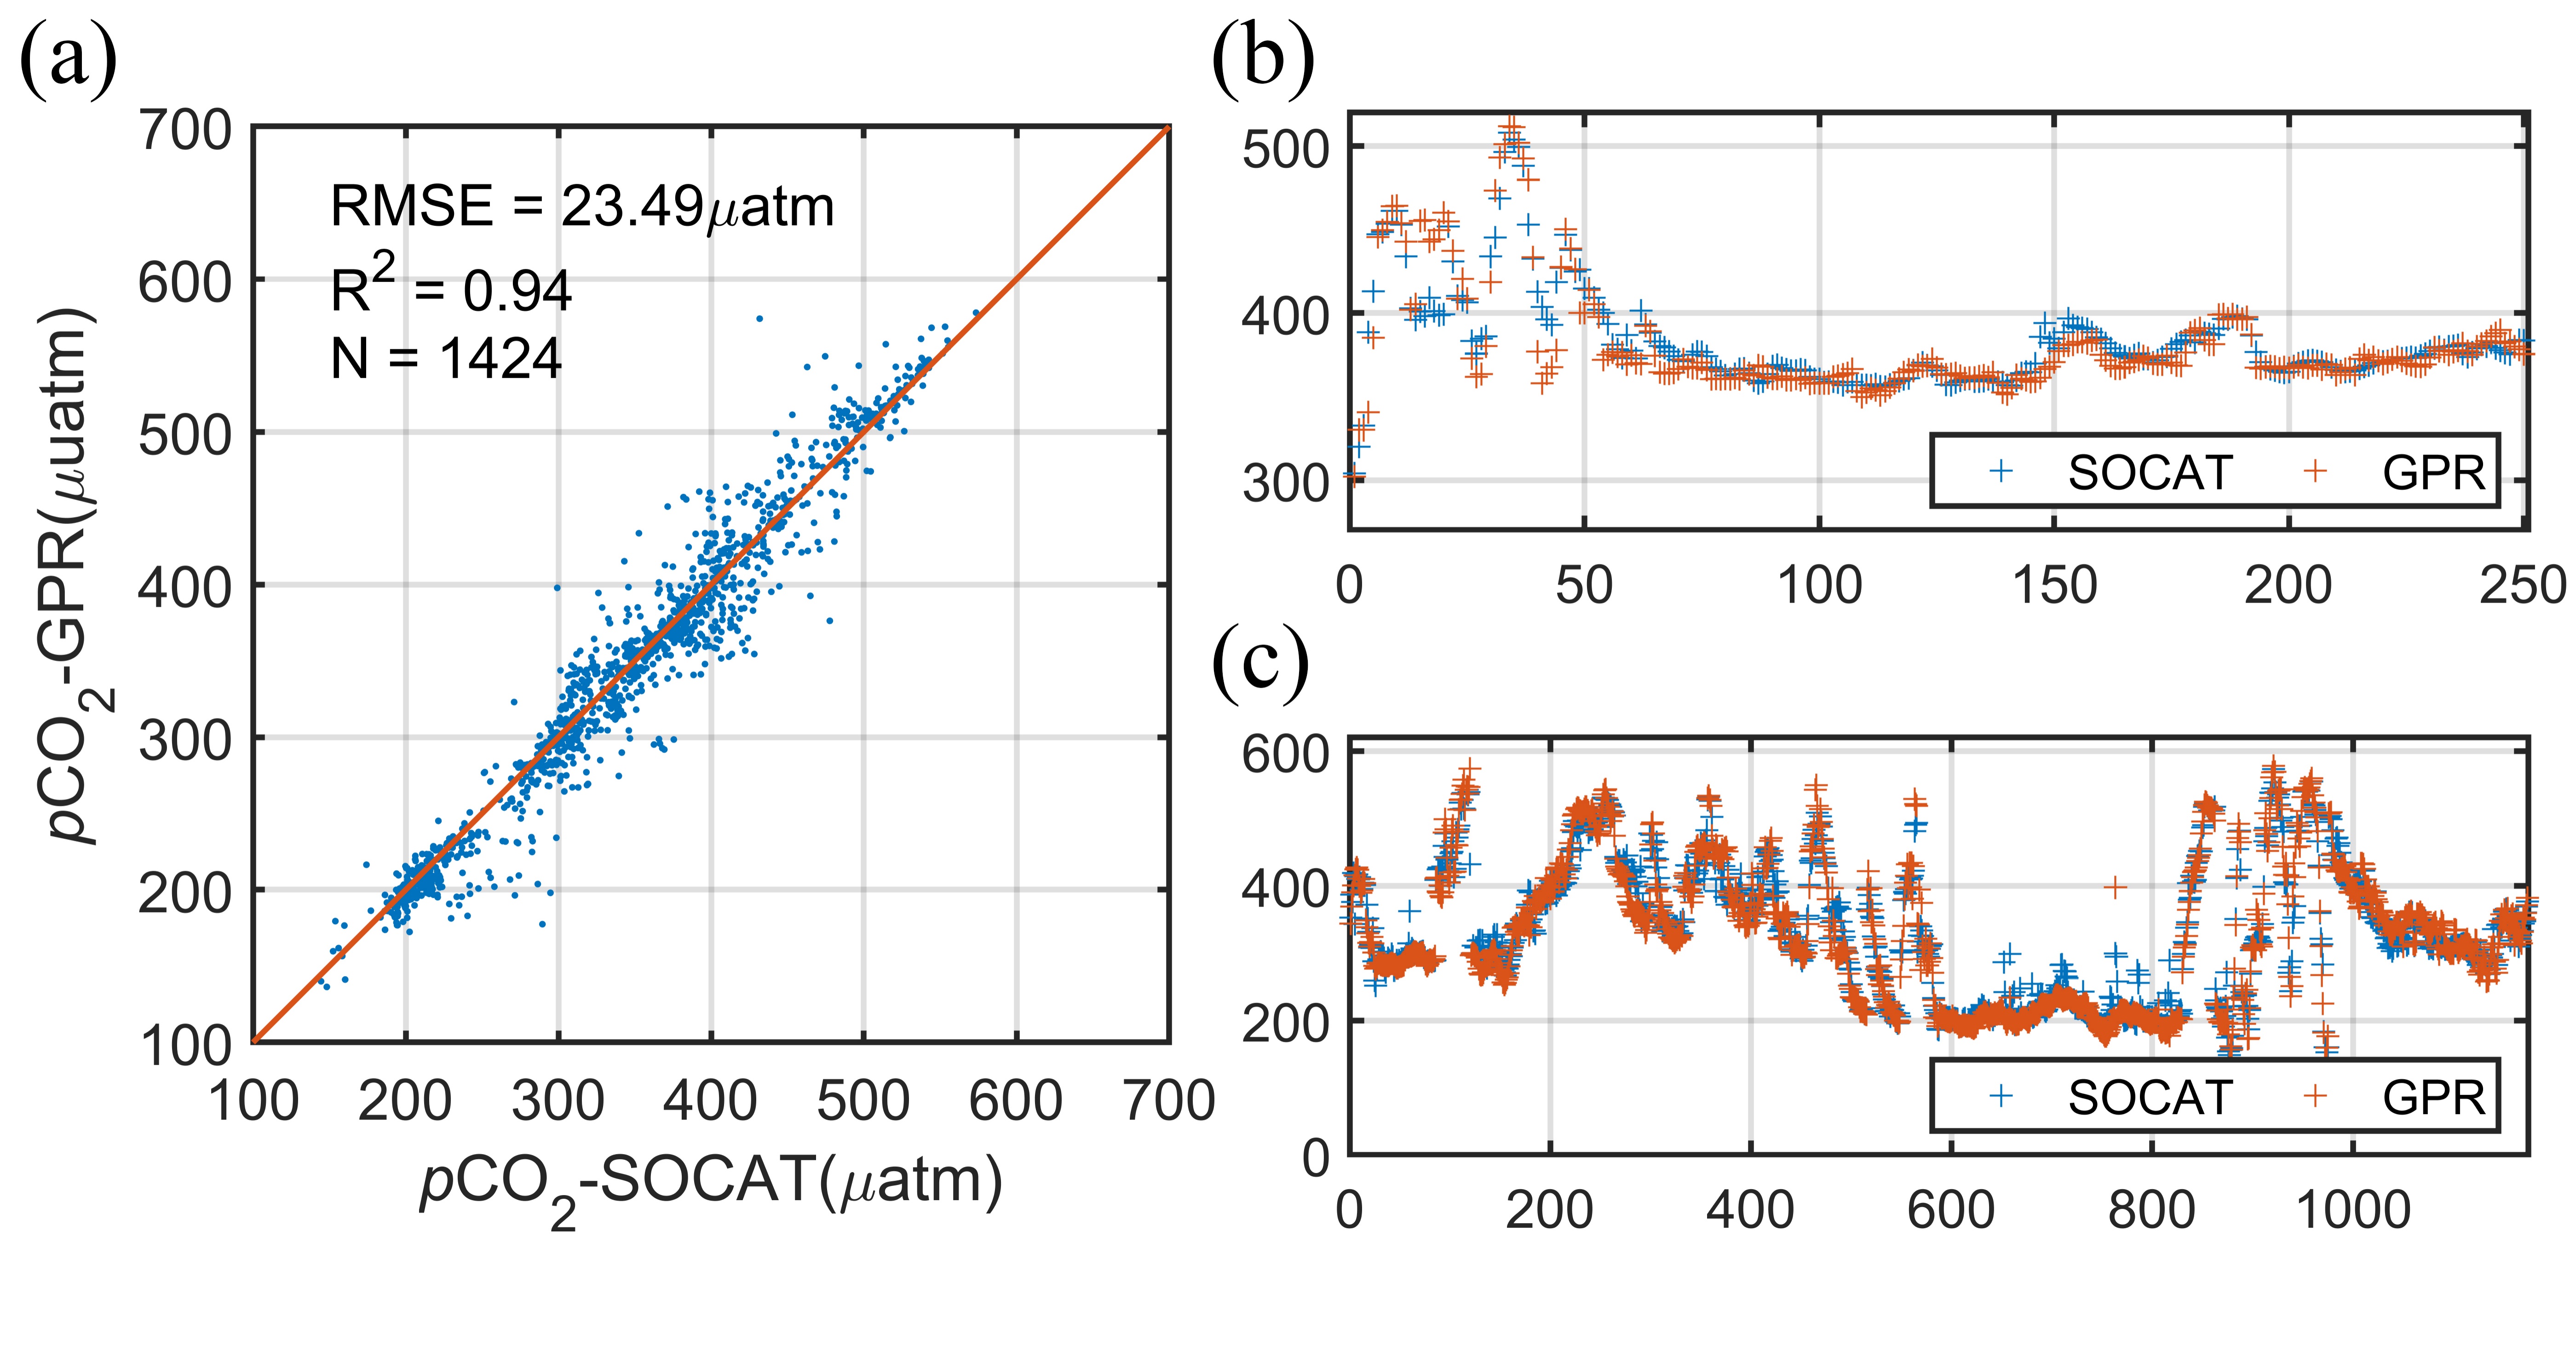
This study used the GPR method to invert pCO2 in the Bering Sea using 6 parameter combinations as model input parameters (XCO2, Chla, SSH, MLD, SST and water depth data). Verified by the evaluation data set, the RMSE of seawater pCO2 retrieved in the continental shelf area is 23.08 μatm (R2= 0.91), and the RMSE in the ocean basin area is 12.56 μatm (R2=0.96). The study retained two voyages with larger coverage for independent verification (1424 groups of observation data), with an RMSE of 23.49μatm (R2=0.94) (see Figure 1). The GPR algorithm can better simulate the spatiotemporal distribution characteristics of pCO2 in the Bering Sea seawater.

Figure 1 (a) Comparison of the GPR algorithm inversion results obtained from the Bering Sea independent validation set and the observation data. (b) ocean basin and (c) continental shelf
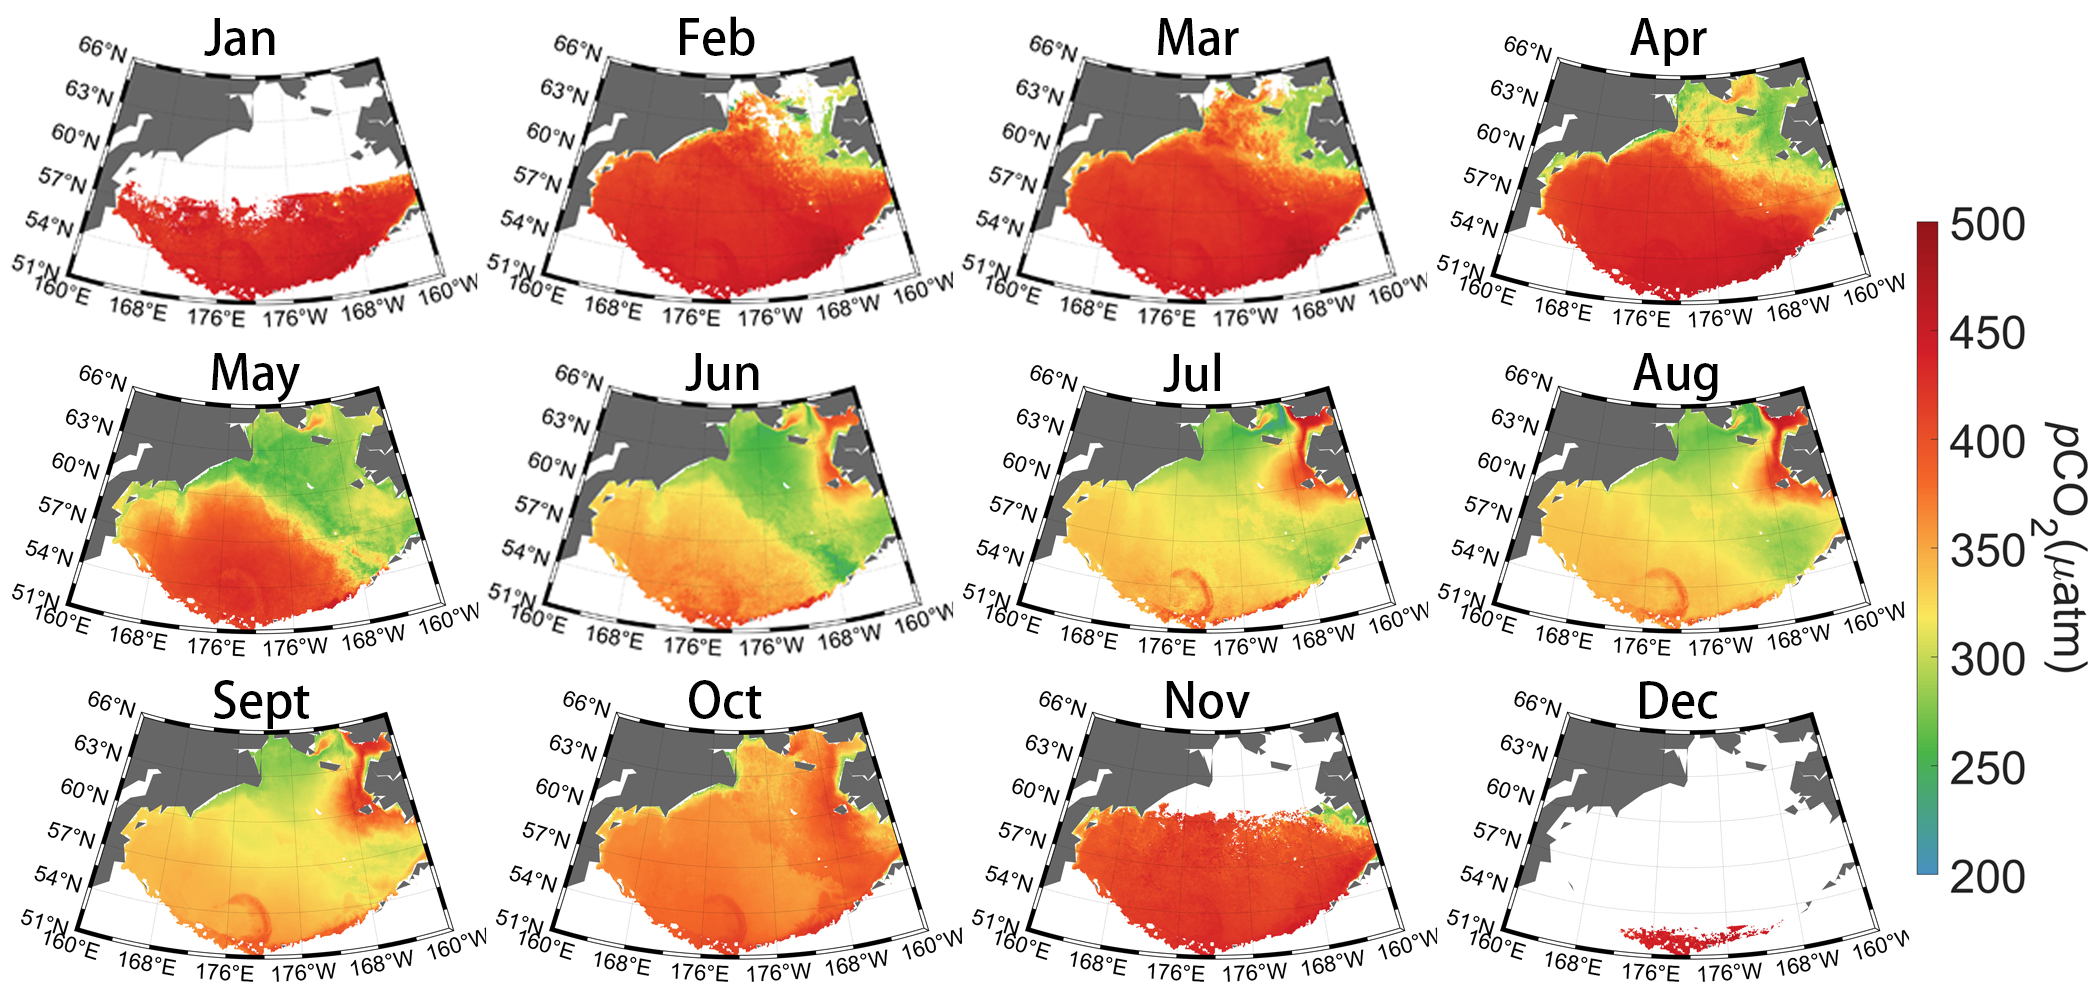
On this basis, the monthly average product of the Bering Sea seawater pCO2 remote sensing for 17 years from 2003 to 2019 was inverted, with a spatial resolution of 4km. As shown in Figure 2, from 2003 to 2019, the Bering Sea seawater pCO2 value ranged from 250 to 450 μatm, showing obvious seasonal and spatial changes. Although both the continental shelf and sea basin areas showed a typical subpolar pCO2 seasonal change pattern, That is, seawater pCO2 is lower in summer, and seawater pCO2 is higher in winter and spring. However, the seasonal changes in the ocean basin and shelf area are not synchronized. The seasonal decrease of pCO2 in shelf seawater is 2-3 months earlier than that in the ocean basin area, and between 4 and 9 The pCO2 of the lunar shelf seawater remains at a low value.
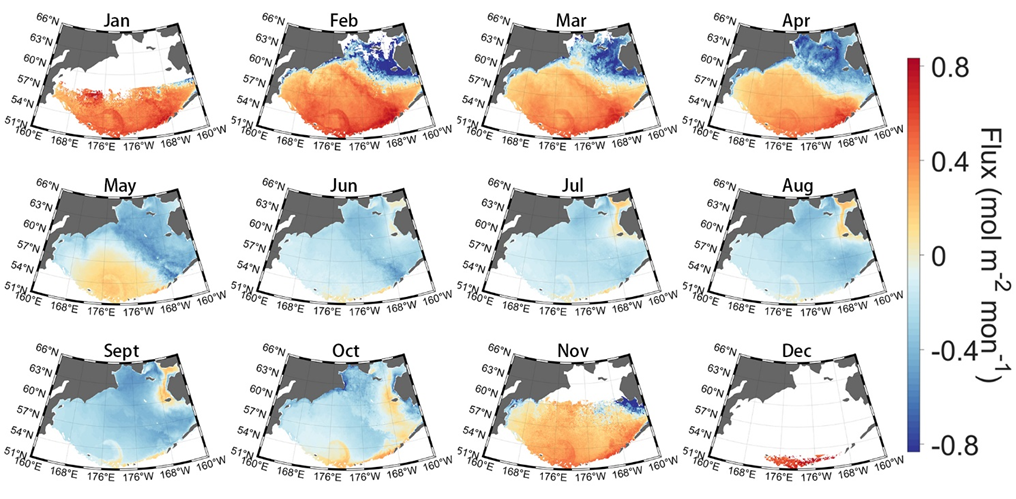
The research team reconstructed the Bering Sea sea-to-air CO2 flux from 2003 to 2019. Its seasonal changes are similar to those of seawater pCO2, and the average sea-to-air CO2 flux is about ±0.7 mol m−2 mon-1. Overall, seawater releases CO2 into the atmosphere from November to April of the following year, and becomes an atmospheric CO2 sink from June to October. With the exception of the Alaskan coast, the continental shelf continues to act as a sink for atmospheric CO2, reaching its maximum CO2 absorption in spring. The Alaskan coast acts as a weak source of atmospheric CO2 in summer, especially from June to August. The southern Bering Sea (coast of the Aleutian Islands) overall appears as a carbon source. Due to the lack of seawater pCO2 in winter, there are also many missing sea-to-air CO2 flux data in winter.

Figure 2 Bering Sea-climate state monthly average sea surface pCO2 from 2003 to 2019

Figure 3 Bering Sea-climate state monthly average sea-atmosphere CO2 flux from 2003 to 2019
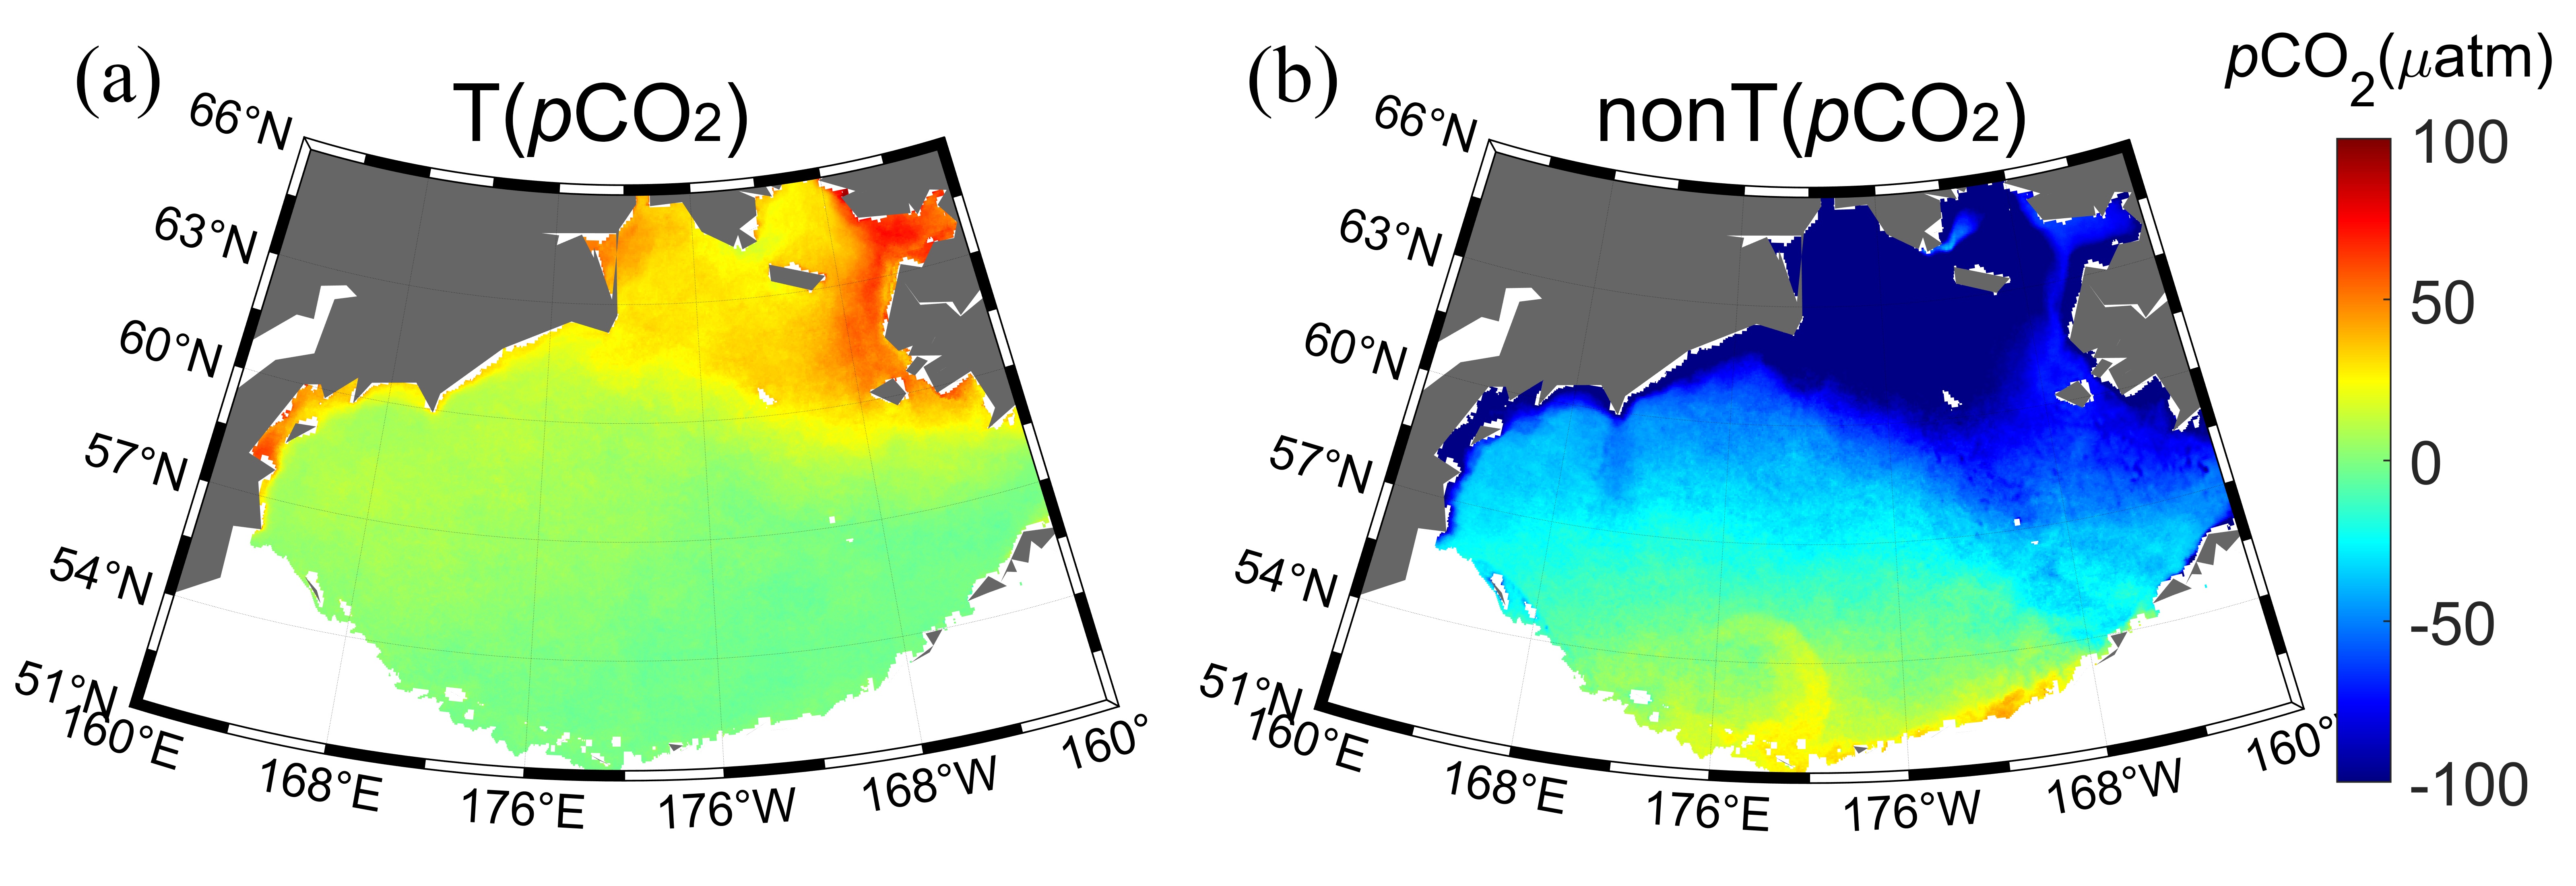
This paper calculates the effect of temperature on seawater pCO2 (T(pCO2)), as well as the effect of all other non-temperature processes on seawater pCO2 (nonT(pCO2)) (Figure 4). The results show that in the Bering Sea, non-temperature effects, including biological effects, upwelling and seasonal mixing, jointly dominate the spatiotemporal changes of seawater pCO2; T(pCO2) and nonT(pCO2) have opposite effects, while non-temperature effects are larger than temperature. The effect is ~2-4 times larger, with an average contribution of temperature effects of 12.7 μatm and an average non-temperature effect of −51.8 μatm. This difference also confirms the conclusion proposed by previous researchers that temperature is not the main control mechanism of pCO2 changes in the Bering Sea seawater.

Figure 4 Contribution distribution of (a) temperature effect and (b) non-temperature effect to seawater pCO2 in the Bering Sea-climate state from 2003 to 2019
In the context of continued rise in atmospheric pCO2 (about 2.1 μatm yr−1), the carbon source/sink patterns of the Bering Sea basin and continental shelf evolve in different directions. From 2003 to 2019, the ocean basin serves as the source of atmospheric CO2, and seawater pCO2 continues to increase (2.8 μatm yr−1). There is no obvious trend change in seawater pCO2 in the continental shelf sea area, which has always remained at a low value of <360 μatm (seasonal fluctuation is ±63 μatm). Its primary productivity is high and it is an important carbon sink. Overall, the Bering Sea can be viewed as a growing carbon sink. Due to changes in the carbonate system, the seasonal amplitude of seawater pCO2 in the shelf area is also increasing significantly, which may affect the carbon sink capacity of the Bering Sea in the future.
Citation:
Zhang S, Bai Y*, He X, Jiang Z, Li T, Gong F, Yu S and Pan D (2023) Spatial and temporal variations in sea surface pCO2 and air-sea flux of CO2 in the Bering Sea revealed by satellite-based data during 2003–2019. Front. Mar. Sci. 10:1099916.


