Recently, researcher BAI Yan and her collaborators in our laboratory published papers titled "Construction of a High Spatiotemporal Resolution Dataset of Satellite-Derived pCO2 and Air–Sea CO2 Flux in the South China Sea (2003–2019)” and “Satellite -estimated air-sea CO2 fluxes in the Bohai Sea, the Yellow Sea, and the East China Sea: patterns and variations during 2003-2019”. The first units of the paper are the Second Institute of Oceanography of the Ministry of Natural Resources. The first authors are SONG Zigeng, a doctoral student jointly trained by our office and Hohai University, and a doctoral student jointly trained with Zhejiang University. YU Shujie, the corresponding author is Researcher BAI Yan, and her collaborators include Researcher HE Xianqiang, Professor GUO Xianghui of Xiamen University, Professor ZHAI Weidong of Guangdong Laboratory of Southern Marine Science and Engineering (Zhuhai), Associate Researcher ZHAO Huade of the National Ocean Monitoring Center, and DAI Minhan of Xiamen University academician.
The ocean is the largest active carbon reservoir on earth, absorbing about 26% of anthropogenic CO2 emissions and playing an important role in the global carbon cycle. China's sea area is vast and its carbon sink potential is huge. After more than 20 years of research, the source and sink status of China's offshore waters has been basically clarified. However, the coverage of observation data in different sea areas varies greatly, and there is still a large uncertainty in the estimation of carbon sinks. Therefore, it is necessary to construct a satellite remote sensing inversion algorithm and gridded data set of seawater partial pressure of CO2 (pCO2) with large spatial coverage and high precision to understand the spatiotemporal changes of sea-to-air CO2 flux in different sea areas, and to accurately assess China's sea carbon sources and sinks. The assessment of patterns, changing trends and potential for increasing exchange rates has important scientific significance and practical application value.
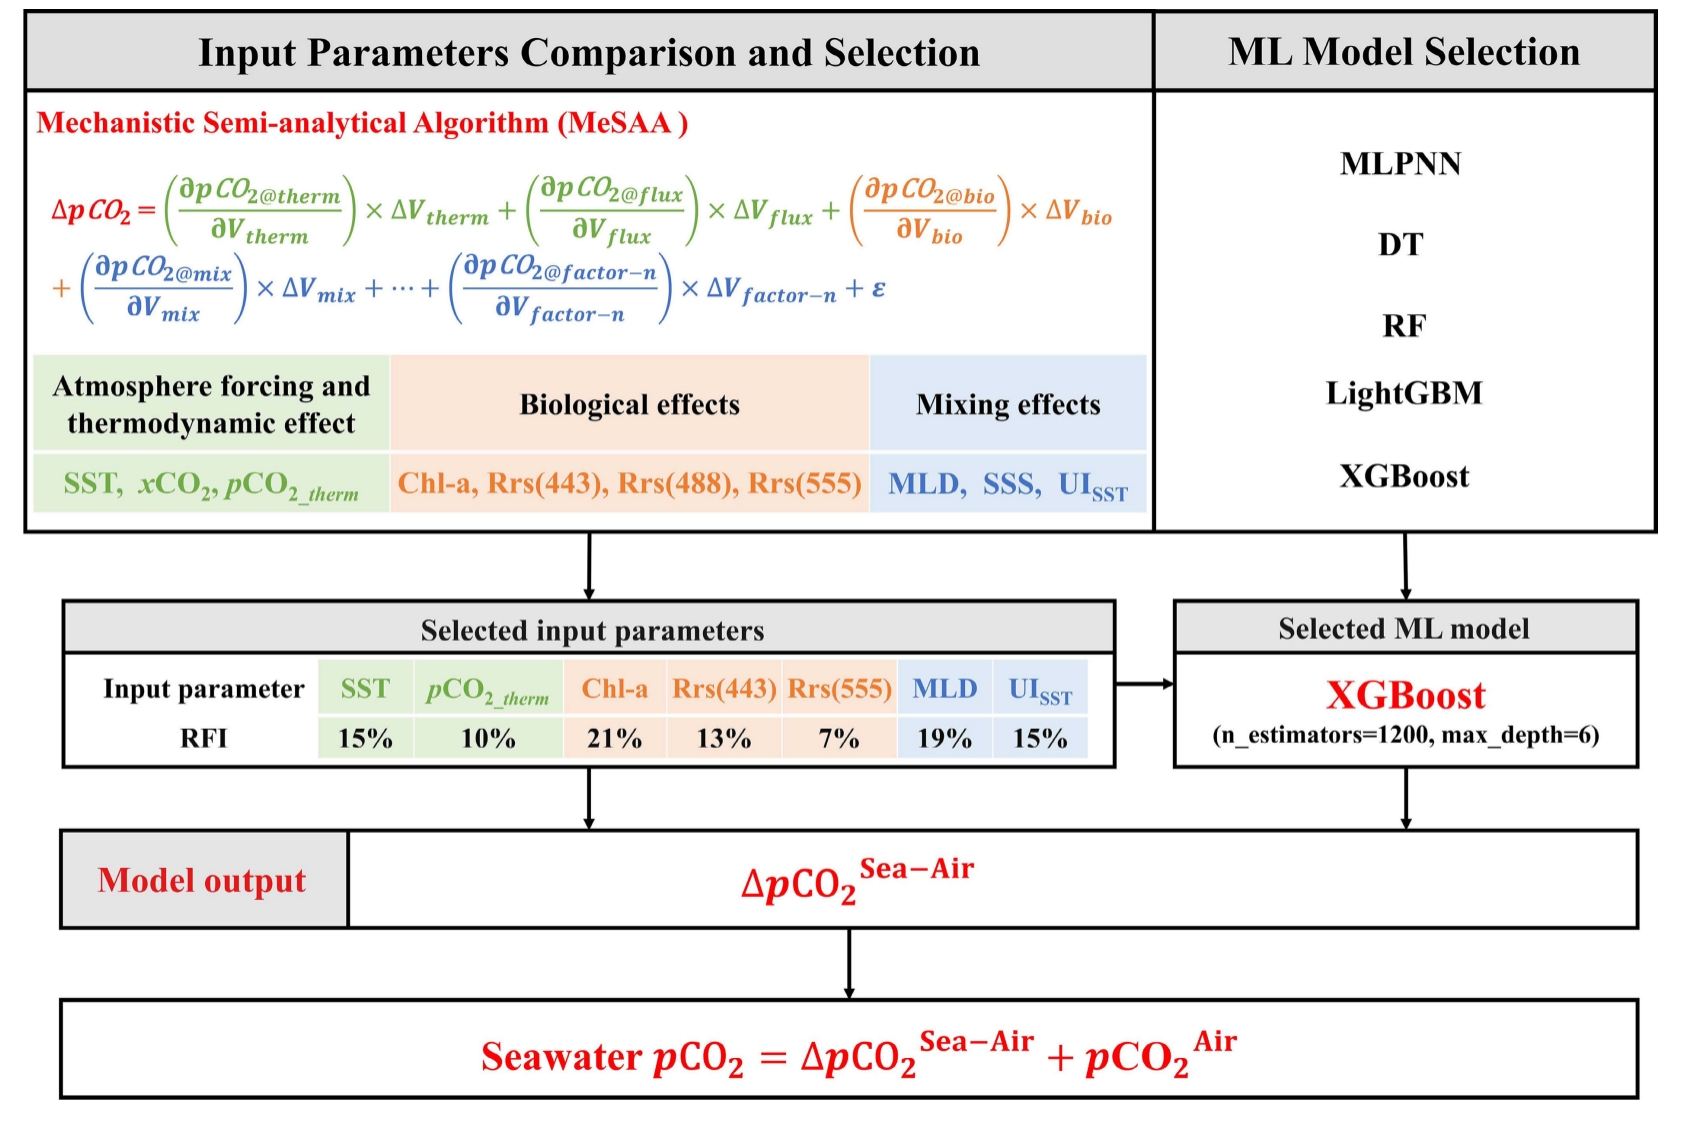
In the early stage, the team innovatively proposed a semi-analytical remote sensing model framework (MeSAA) for seawater CO2 partial pressure based on control factor analysis, which analytically and semi-analytically quantified the iterative effects of temperature thermodynamics, mixing, biological effects, and air-sea CO2 flux on seawater CO2. etc., effectively solved the remote sensing inversion problem of seawater CO2 partial pressure in complex marginal seas. The MeSAA algorithm framework has successfully realized the remote sensing retrieval of seawater CO2 partial pressure in the Yangtze River-East China Sea system, the Pearl River-Northern South China Sea system, and the Mississippi River-Gulf of Mexico system influenced by large rivers, as well as in the Bering Sea and the Coral Sea dominated by ocean basin processes.
Due to the high variability of multiple water masses in the China Sea and the complexity of the ecosystem, the current MeSAA algorithm is difficult to adapt to the parameterization problems of some extremely complex processes. This study innovatively proposes a method that combines the MeSAA algorithm and a machine learning model (XGBoost) (Figure 1), the mechanism-driven pCO2 remote sensing inversion algorithms MeSAA-ML-ECS and MeSAA-ML-SCS suitable for the Bohai Sea, the East China Sea and the South China Sea were constructed respectively. Compared with traditional machine learning methods, this algorithm has higher accuracy and better performance. Good mechanistic interpretability. Independent voyage data verification shows that the root mean square errors of remote sensing pCO2 products in the Bohai-Huanghai East China Sea and the South China Sea are 19.60 μatm and 11.69 μatm respectively, and the average absolute errors are 4.12% and 1.59% respectively. Compared with the SEATS time series station observation data in the South China Sea, both The root mean square error is only 5.27 μatm; compared with the multi-year observation data of the East China Sea PN section, the root mean square error is 16.39 μatm, and it has the ability to quantify the changing trend.

Figure 1 Algorithm idea (taking the South China Sea as an example).
Based on this algorithm, the team produced and released a 1 km resolution monthly average seawater pCO2 and air-sea CO2 flux remote sensing grid data set covering the entire China Sea, which is currently the highest spatial resolution and accuracy of sea-air CO2 in the China Sea. Flux remote sensing data set. This dataset is open access on the data sharing platform Zenodo (East China Sea data https://doi.org/10.5281/zenodo.7701112, South China Sea data https://doi.org/10.5281/zenodo.7743187), and has also been integrated in Ocean Remote Sensing The online analysis platform SatCO2 is released and shared.
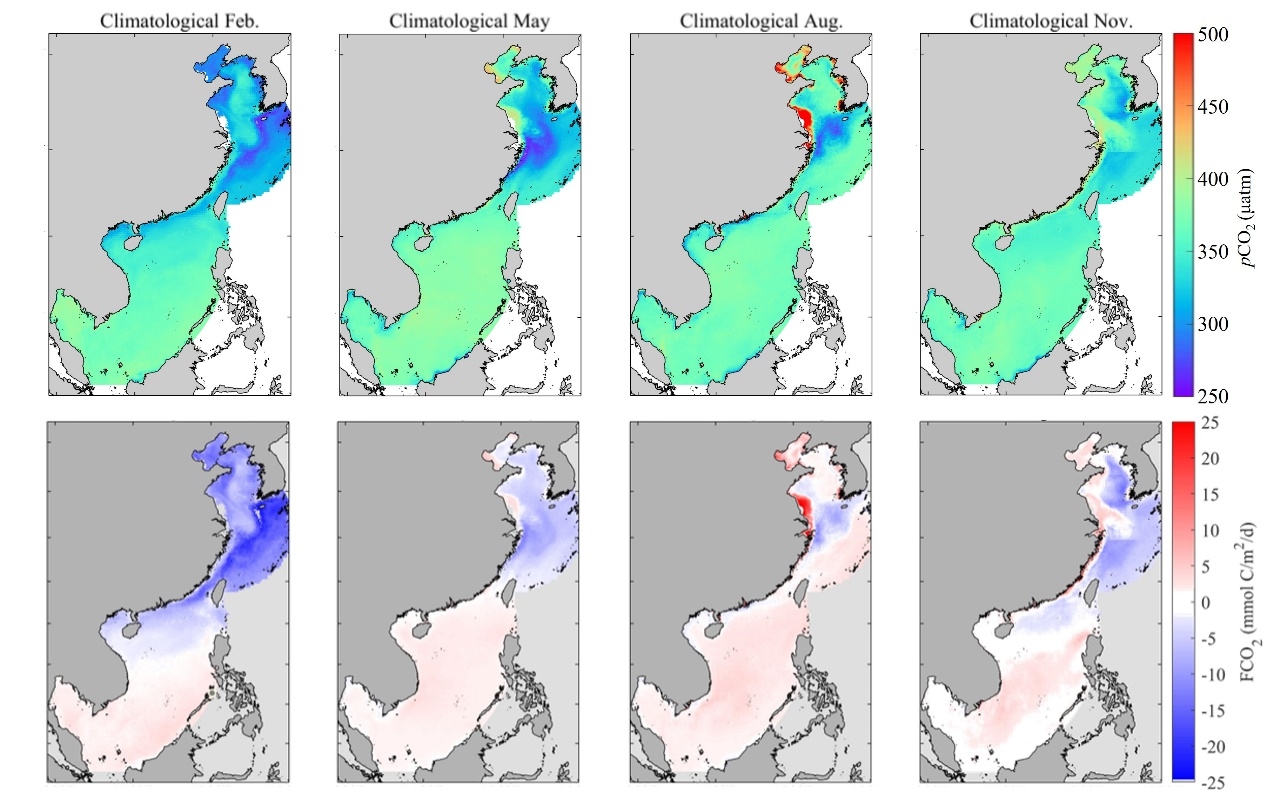
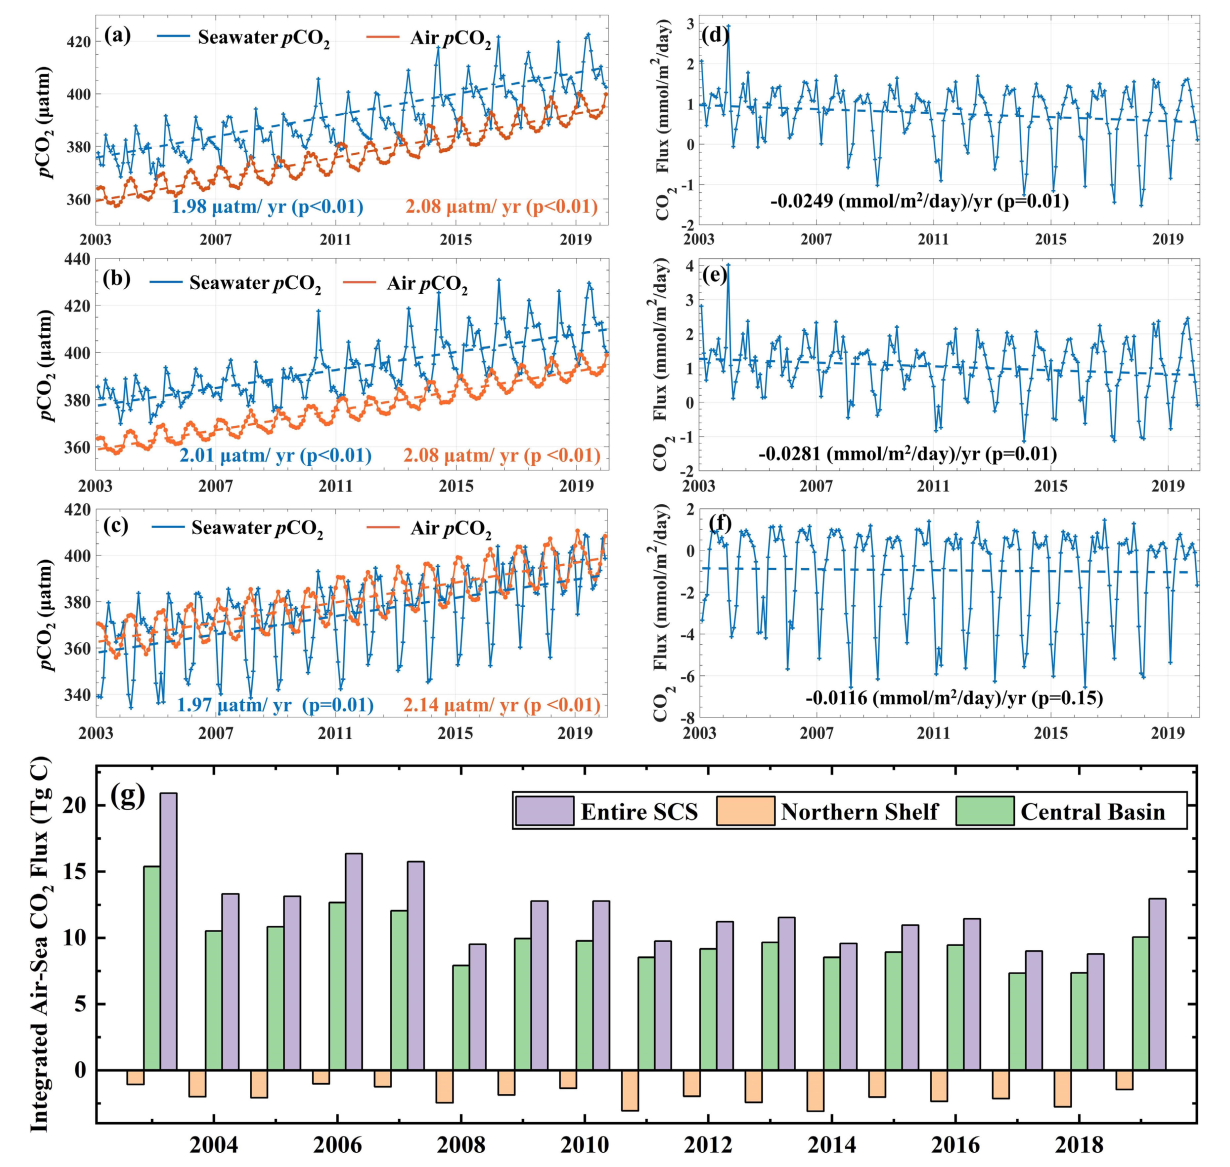
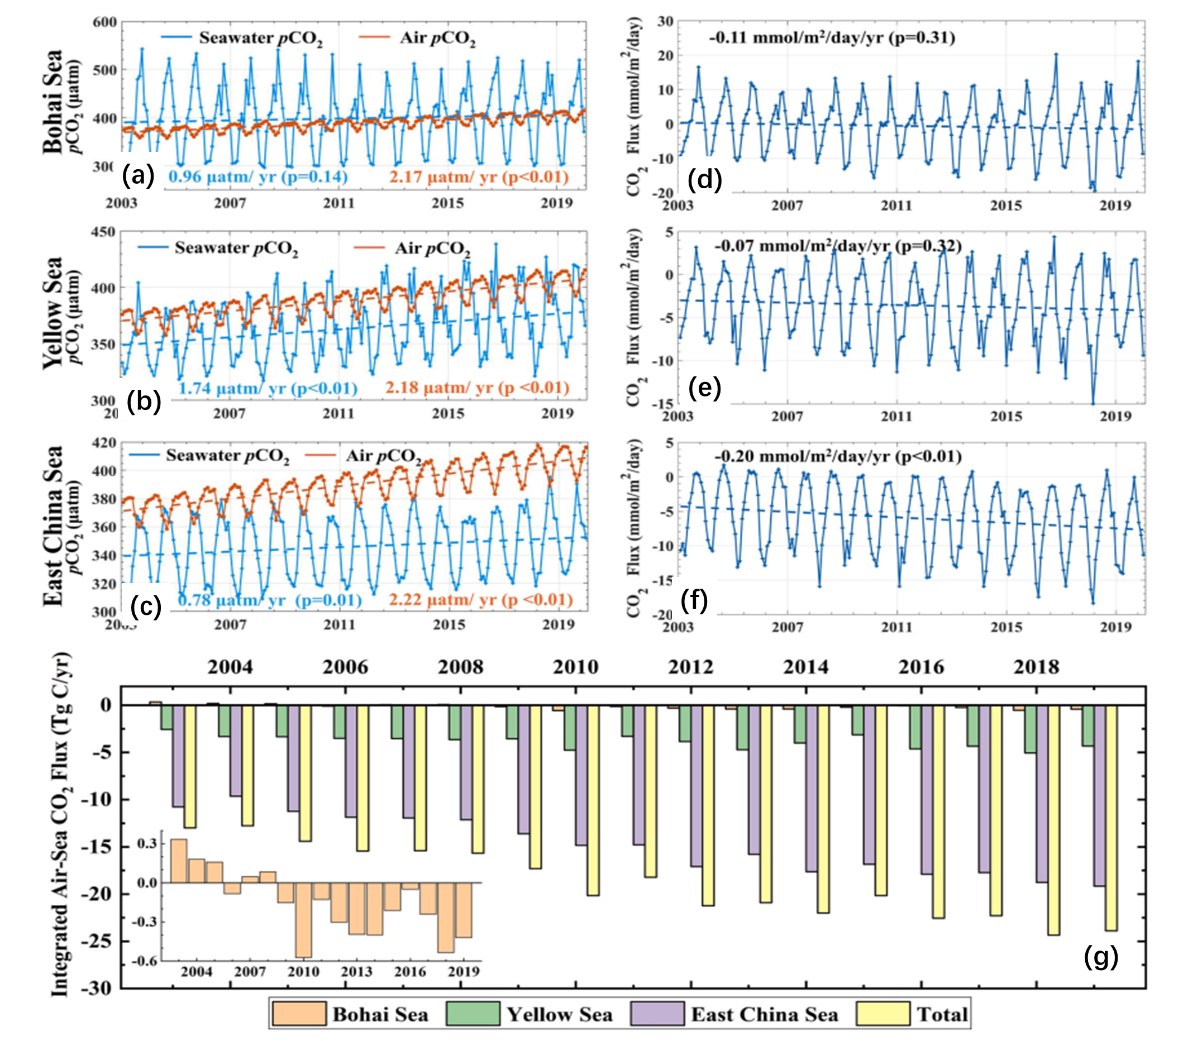
The high-precision, high-spatial-temporal resolution remote sensing data sets of seawater pCO2 and sea-to-air CO2 flux have accurately depicted the long-term changes in China's sea carbon source sink pattern and understood the carbon absorption/emissions in each sea area (Figure 2-3). The Bohai Sea is a strong source of atmospheric CO2 in summer and a strong sink in winter, absorbing an average of 0.16 Tg C from the atmosphere per year; the Yellow Sea is a carbon source from July to September and a carbon sink in the remaining months, absorbing an average of 3.85 Tg C per year; the East China Sea is Atmospheric CO2 is a carbon sink, absorbing an average of 14.80 Tg C per year; the northern continental shelf of the South China Sea is a carbon sink in winter and a carbon source in the other seasons, absorbing an average of 2.02 Tg C per year; the South China Sea basin is a carbon source year-round, releasing an average of 9.89 Tg C per year. The study also preliminarily analyzed the changing trend of carbon sinks in the China Sea. During 2003-2019, the carbon sink capacity of the Bohai Sea and the East China Sea increased significantly, while carbon emissions in the South China Sea decreased significantly.

Figure 2 Spatial distribution of average pCO2 and air-sea CO2 fluxes in February, May, August and November (representing winter, spring, summer and autumn respectively) from 2003 to 2019.
Figure 3. (a) - (c) Change trends of seawater and atmospheric CO2 partial pressure in the Bohai Sea, the Yellow Sea, and the East China Sea from 2003 to 2019. (d) - (f) Change trends of air-sea CO2 flux in the Bohai Sea, the Yellow Sea, and the East China Sea. The dashed line is the linear fitting curve. (g) Regional average of annual air-sea CO2 flux in the sea area. The attached figure shows changes in the Bohai Sea with the zoomed-in coordinate axis.

Figure 4. (a) - (c) Trends in seawater and atmospheric CO2 partial pressure in the South China Sea, the central basin and the northern shelf of the South China Sea from 2003 to 2019. (d) - (f) Change trends of air-sea CO2 flux in the South China Sea, the central basin of the South China Sea and the northern continental shelf. The dashed line is the linear fitting curve. (g) Regional average of annual air-sea CO2 flux in the sea area.
Citation:
[1] Yu, S., Song, Z., Bai, Y.*, Guo, X., He, X., Zhai, W., Zhao, H. & Dai, M. (2023). Satellite-estimated air-sea CO2 fluxes in the Bohai Sea, Yellow Sea, and East China Sea: Patterns and variations during 2003–2019. Science of The Total Environment, 904, 166804. https://doi.org/10.1016/j.scitotenv. 2023.166804.
[2]Song, Z., Yu, S., Bai, Y.*, Guo, X., He, X., Zhai, W., & Dai, M. (2023). Construction of a high spatiotemporal resolution dataset of satellite-derived pCO2 and air-sea CO2 flux in the South China Sea (2003-2019). IEEE Transactions on Geoscience and Remote Sensing. https://doi.org/10.1109/TGRS.2023.3306389.


