Recently, our team of researchers from BAI Yan and their collaborators published a paper titled "Three stages in the variation of the depth of hypoxia in the California Current System" in the TOP journal Science of The Total Environment (IF=10.75). 2003–2020 by satellite estimation (based on satellite inversion of three-stage changes in the upper boundary depth of the mid-ocean anoxic zone in the California Current system from 2003 to 2020)” research paper. The first author of the paper is ZHANG Yifan, a doctoral student jointly trained by our laboratory and Shanghai Jiao Tong University. The corresponding author is researcher BAI Yan of our laboratory. The collaborators include researcher HE Xianqiang, Dr. LI Teng, senior engineer GONG Fang and doctoral candidate JIANG Zhiting of our laboratory.
The amount of oxygen (O2) in the ocean is a limiting factor for ecosystem productivity, biodiversity and biogeochemical cycles. Under steady-state conditions, O2 exists in the form of dissolved oxygen (DO) in the seawater environment. DO is very sensitive to changes in biological cycles. Therefore, it is considered an important characteristic signal of changes in marine biogeochemical cycles. The current impact of global climate change is obvious to all. The oxygen concentration of the global ocean is continuing to decline. For the middle ocean, abnormal changes in the ocean environment superimposed on human activities will produce complex biogeochemical responses. One of its effects can lead to the minimum content of the middle ocean. The formation depth of oxygen minimum zones (OMZs) becomes shallower, which has a fatal impact on the stability of the ecosystem and the economic development of fisheries, especially in coastal marine ecosystems. The depth of the upper boundary of the mid-ocean anoxic zone (depth of hypoxia, DOH, based on DO=60 μmol kg-1) can be used to judge the extent of the longitudinal expansion of the OMZ in the water column, and to evaluate its impact on the mid-ocean ecosystem, helping to identify and Anticipate changes in favorable habitats for aquatic life. However, the current amount of in-situ DO measurement data is still insufficient to complete long-term series, high spatial and temporal resolution research on the evolution characteristics of mid-ocean DOH, especially in complex coastal waters.
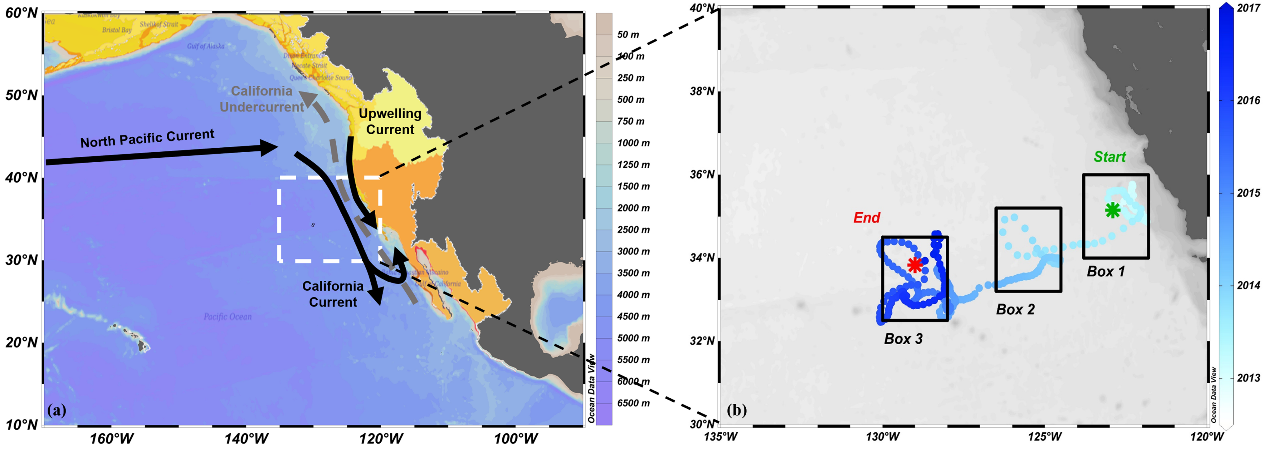
Satellite remote sensing can provide long-term, large-area synchronous information on marine ecological environment changes. This study is based on the in-situ dissolved oxygen profile observation data collected continuously by a single BGC-Argo float deployed in the California Current System (CCS) with the longest continuous working time (observation period was from November 18, 2012 to 2016 August 31, 2018) (Figure 1), taking into account the physical vertical mixing process and biological activity processes such as phytoplankton photosynthesis that regulate the dissolved oxygen balance in the sea area, a DOH non-linear model was constructed based on satellite net productivity and sea surface temperature remote sensing data. The linear polynomial regression inversion model realizes the remote sensing inversion of DOH in CCS sea areas. After verification with actual measured data, the overall results are R2=0.82 and RMSE=37.69 m (n=80).

Figure 1 (a) Flow field and main economic fish activity range of California Current System (CCS) (modified from Checkley and Barth, 2009); (b) Working trajectory of BGC-Argo No. 5904021, movement time is From November 18, 2012 to August 31, 2016, the color represents the observation time, and the green and red asterisks represent the starting point and key end point of the buoy work respectively. The boxes in the figure are all 2°×2°.
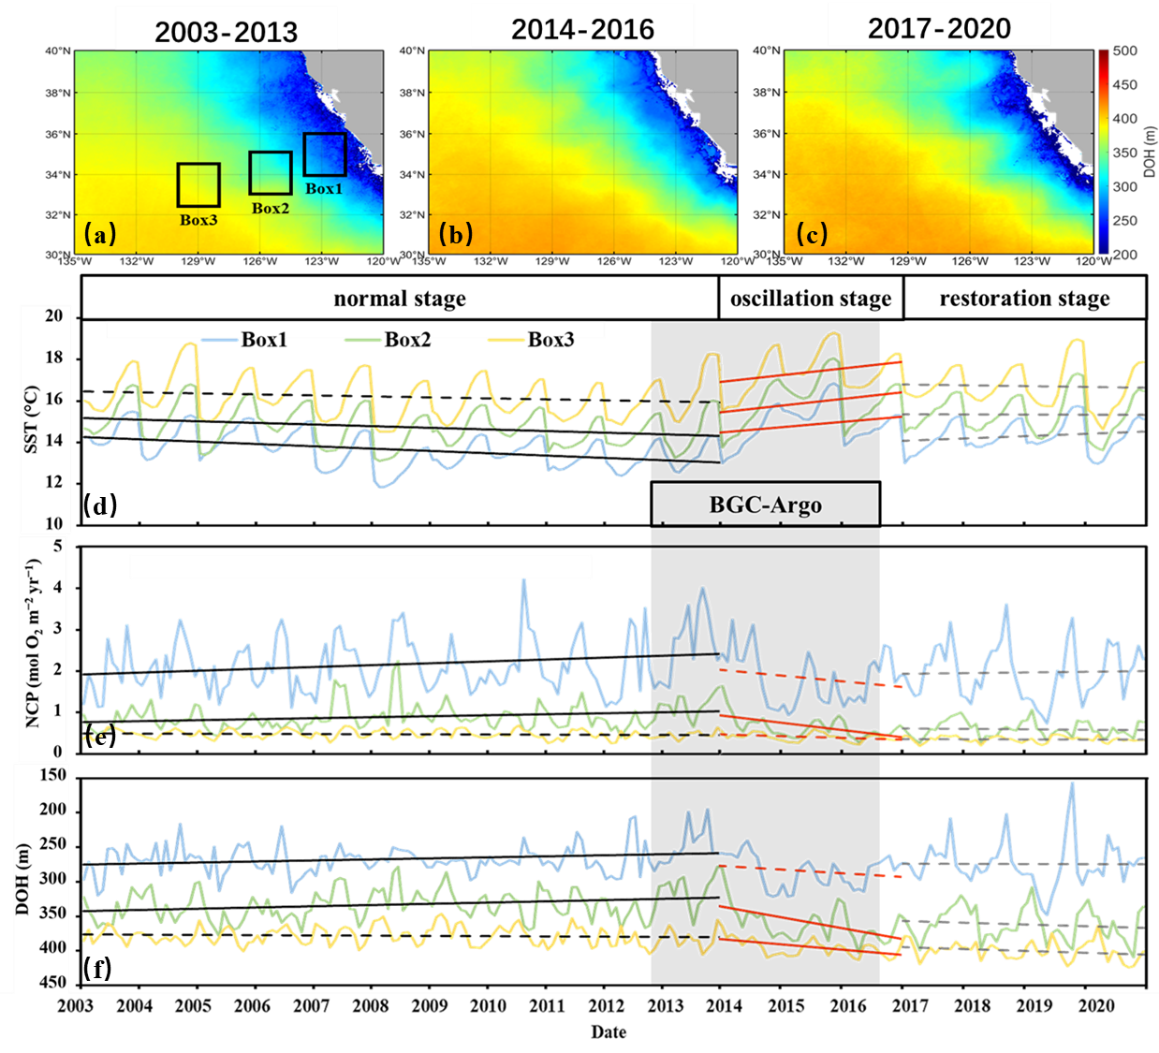
On this basis, this study reconstructed the 18-year DOH evolution process of CCS from 2003 to 2020. The results show that from 2003 to 2013, the coastal waters of CCS were strongly affected by the enhanced upwelling, and deep nutrients continued to rise to stimulate surface phytoplankton. Productivity, which subsequently leads to the rapid occurrence of oxygen consumption processes in the water column, eventually triggering the formation and continued expansion of the mid-level OMZ; based on satellite inversion results, DOH in CCS offshore waters shows a significant shallowing trend over time (p<0.05, n=132); Subsequently, the region suffered two consecutive large climate shock events, including the abnormal warming event in the eastern Pacific in 2014-2015 and the subsequent El Niño event in 2015-2016. This has led to changes in the change trends of multiple environmental parameters that have slowed down or even completely reversed. For example, DOH has deepened change signals, temporarily slowing down the expansion of the OMZ, or dead zone; after 2017, the CCS ecosystem is gradually getting rid of the aforementioned climate shock events. Affected by the impact, DOH as a whole no longer shows a significant deepening trend, but as of the end of 2020, DOH has not yet fully recovered to the significant shallowing characteristics it showed before 2014 (Figure 2). Without further human interference, the ecosystem will likely gradually return to the environmental pattern before 2014, which means that there is a high possibility that the DOH of CCS will become shallower in the future. The DOH satellite inversion model developed in this study based on the upper boundary depth of the hypoxic zone in the middle ocean of the CCS ecosystem provides a new perspective for exploring the long-term high-resolution marine ecosystem and the spatiotemporal regularity of hypoxia changes.

Figure 2 The change distribution map of the upper boundary depth (DOH) of the anoxic zone in the middle ocean from the satellite retrieval of the California Current System (CCS) from 2003 to 2020, which can be divided into three stages: (a) Conventional climate period (2003~2013) , (b) climate oscillation period (2014~2016) and (c) climate recovery period (2017~2020). The position of the Box in Figure (a) is consistent with Figure 1 and coincides with the trajectory of BGC-Argo. Figures (d-f) show the long-term changes in the average sea surface temperature, net productivity and DOH of the three boxes, which are also divided into three stages. The change trend linear fitting result p<0.05 is represented by a solid line, and vice versa, it is represented by a dotted line. The gray shade in the figure is the BGC-Argo running time.
Citation: Zhang, Y., Bai, Y.*, He, X., Li, T., Jiang, Z., & Gong, F. (2023). Three stages in the variation of the depth of hypoxia in the California Current System 2003–2020 by satellite estimation. Science of The Total Environment, 162398.

